In April 2022, Good Jobs First released its latest assessment of the quality of states’ disclosure of their major subsidy programs. While overall transparency was improved over 2014, some states remain laggards and two (Alabama and Georgia) received zeros: meaning residents have no meaningful way of evaluating the effectiveness of subsidies they provide companies: no company names, no awards totals, no outcomes tracking, and no advance notice.
But there were bright spots, which included first-place Nevada. Its score of 63.6, out of 100, was more than 10 points ahead of second-place Connecticut.
What does the state’s transparency look like in practice? Here’s an example from a $105.6 million subsidy Nevada recently approved to Redwood Materials, Inc., for an electric vehicle battery materials facility.
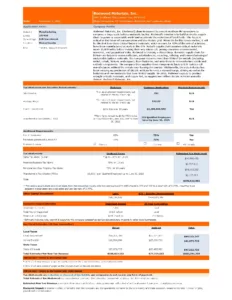
Page 1 is highly illuminating. Of course, it lists the name of the recipient as well as the program under which the incentives were granted (“Type of app.: $1 billion investment,” i.e., it is a program that requires a private investment of at least that much). It lists the number of jobs (701), average wage ($32.03, although using the average wage means a handful of high-paid executives could be driving that up; median wage would be better), amount of investment ($1.1 billion), and the number of jobs for which transferrable tax credits (225) can be given.
The document then itemizes the types of subsidies Redwood is eligible for. Of the total $105.6 million, two programs dominate the subsidy: the Personal and Real Property Tax Abatement ($54.1 million) and the Sales Tax Abatement ($46.6 million), with two other abatements of under $3 million each.
Importantly, all the subsidies are listed in one place. Too often, subsidy details dribble out over time, making it difficult to put a price tag on the total cost. This has become increasingly true in recent years, as governors seek to obscure costs while of course trumpeting alleged benefits.
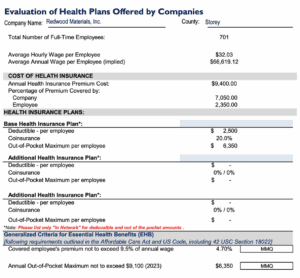
The document also goes into employee benefits, an important part of any job-creation package. Here’s an excerpt, for example, about health plans offered:
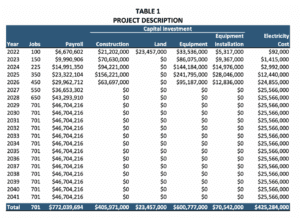
The project application also includes information about the company’s capital investments, including energy costs. The breakdown emphasizes a little-known fact about electric vehicle and EV battery production: while their end products reduce fossil-fuel consumption, the making of the cars and batteries themselves is very energy-intensive, more so than internal-combustion auto manufacturing. That’s why energy subsidies, in the form of utility tax abatements and/or “economic development” rate discounts, are sometimes big components of EV subsidy packages.
Page 1 also summarizes projected economic and fiscal impacts from a different section of the application, but these estimates are imprecise and a topic for another day (“economic impact” reports are often notoriously overstated).
Despite my quibbles, document as a whole establishes clear benchmarks for what the project must do to earn all the incentives being offered at the state and local level. We can see who pays what (county or state), and how much for the four categories of incentives the billion-dollar investment unlocks.
Companies often claim releasing information like what’s found in Nevada’s disclosure reports would damage them competitively by revealing “proprietary business information,” or trade secrets. But of course that is nonsense: many states have long required it, and laggard states should do the same.
It’s almost 2023. States started posting detailed subsidy disclosure data online as early as 1999. Do you know where your money is going?