Note: This is the fourth in a new series of quarterly reports produced by Good Jobs First that look at the relationship between race, ethnicity, and economic development.
Most privatized state economic development corporation boards (PSEDCs), the groups some states commission to hand out business incentives, lack equal racial representation. Hispanic people are the most underrepresented, while white and Black PSEDC board members are often overrepresented. Using the PSEDCs featured in our 2013 study Creating Scandals Instead of Jobs, this short report analyzes the racial composition of 140 board members across nine PSEDC boards. I use representation indexing (RI) in my analysis as a proxy for determining the concentration of executive power in state economic development among racial and ethnic groups. In total, people of color held just 27 out of 140 seats— representing less than 20% of decision-making power in nine states.
The Problem
The mission statements of many privatized state economic development corporations all make similar claims—that they will use the state’s top business minds to act on behalf of the government to increase economic prosperity by attracting key industries and creating jobs. On its face, this seems like an objectively reasonable approach to economic development, letting those with private sector experience engage with industry peers to achieve policy priorities.
However, the novelty of this administrative structure has all but worn off since its inception 30 years ago, as researchers have effectively categorized PSEDCs as a type of spoils system. [1] In this system, companies that are most fit to help the state build toward a diverse, sustainable economy often do not receive PSEDC-administered incentives because they lack the allure of a prominent brand name, the right political connections, or the administrative capacity to even apply for these awards.
Introducing race into the equation makes things more complex. Imagine a governor selects 10, sometimes 30, well-off, primarily white, well-connected industry leaders for a state board. They’re tasked with impartially evaluating competing firms to determine how incentives are dispersed. Anyone with a working understanding of representative bureaucracy would find it hard to believe this process isn’t favoring the dominant group—white, wealthy business owners—when they have the largest share of power and can use public funds for their benefit in closed-door hearings. [2]
In a previous report in this series, we established that almost all of the biggest subsidy deals ever awarded were to companies led by white people.[3] This trend is consistent with incentives awarded to companies headquartered in PSEDC states. Since 2021, every recipient of an award from the Indiana Economic Development Corporation, Virginia Economic Development Partnership, and Rhode Island Commerce Corporation had a white chief executive, and each of the PSEDCs had an overrepresentation of whites on its board (Table 2).
The overrepresentation of white people on PSEDC boards is problematic because it is a substantive barrier to racial and ethnic minority group participation in state economic development decisions and may be contributing to the inequitable distribution of state incentive awards in favor of the dominant group.
Key Findings
I surveyed all active board seats at nine privatized state economic development corporations, looking specifically at race and ethnicity to evaluate whether and to what degree white people are overrepresented in the leadership of PSEDCs. My findings indicate the following:
- White people occupy more seats than all board members of color combined. Of 140 available board seats, members identified as white outnumbered their non-white counterparts by more than 4 to 1, as people of color held just 27 (Table 1). Figure 1 also illustrates this point, showing the racial and ethnic demographic distribution of all occupied PSEDC board seats surveyed.
- White and Black board members are overrepresented on PSEDC boards on average, but not at the same rates. Relative to their population distribution on average, white board members are overrepresented by almost a quarter, followed closely by Black board members (Table 2). However, there are still discrepancies in the frequency of overrepresentation across the state boards. Representing an average of 68.2% of the population across the states surveyed, white people neared equal representation (RI => .90) on eight of the boards, occupying 113 seats, or 81% total. Black people scored similarly on only five boards, occupying 16 seats, or 12% total relative to their share of the population at 9.6%.
- Hispanic people are the most underrepresented on PSEDC boards. On average, Hispanic representation is severely unequal (RI <= .40). Hispanic populations were represented on only four of the nine PSEDC boards and only achieved or exceeded population-rate representation on two boards. (Table 2). Of the 140 seats, they held just six – less than 5%.
- People of color are better represented in some states than others. The Michigan Economic Development Corporation has the most comprehensive representation of non-white board members compared to its population—45% of board members were Black, Asian, or Hispanic, compared to representing 23% of the population (see Table 2). The opposite is true in PSEDCs like the Virginia Economic Development Partnership and the Wyoming Business Council, which have no racial or ethnic diversity on their boards despite both states having a considerable Hispanic population and Virginia’s sizeable presence of African and Asian Americans.
Making PSEDCs More Representative
The absence of equal racial representation on PSEDC boards is a good governance issue. The insular networks of majority-white leaders are outdated and should not be considered a viable governance strategy any longer. So, while these organizations struggle with transparency and accountability concerns, the least they can do is address racial equity concerns. As a state’s racial demographics shift, so should the composition of PSEDC board members.
One way to potentially increase board diversity is to appoint more small business leaders. Studies show that the amount of federal contracting and awards going to minority-owned firms is positively correlated to having public managers from diverse racial groups making administrative decisions.[4] Access to external financing, lower revenue, and fewer cash reserves are major contributing factors to the gap in the size of businesses owned and operated by white versus non-white people.[5] So, as minority-owned small companies increase their market share, giving small businesses a seat at the table may create more space for minorities to enter the candidate pool of prospective board appointees. Since former Gov. Rick Snyder’s tenure ended in 2018, the Michigan Economic Development Corporation has increased racial diversity on the board by 11% using this method.
Governors in states like Virginia and Wyoming must especially address racial representation in their PSEDC board appointments. It is not enough for gubernatorial appointment applications to feature an optional demographic check box like those in Rhode Island or Texas. [6] There should be statutory provisions in place in all appointment processes to ensure a more diverse pool of applicants is reviewed based on their qualifications and ability to understand and substantively improve the economic opportunities of all state residents.
Conclusion
Achieving greater racial representativeness in PSEDC boards is more than a moral imperative; it is also a strategic move. State organizations like PSEDCs that struggle to achieve the transparency component of good governance cannot afford to fall short on concerns of racial equality. States can address this by ensuring all citizens are represented equally in decision-making on matters of state economic development. Future research should examine the relationship between the racial composition of economic development decision-making bodies and whether well-represented groups have better outcomes than those from underrepresented groups.
Methodology
Privatized state economic development corporations publish the names and affiliations of active board members during their tenure. Using each of these websites, I was able to identify the total number of board seats occupied and used publicly available biographical information about each member (including profile pictures, affiliations to cultural or ethnic professional groups, etc.) to classify them within the racial or ethnic group that most reasonably fit their profile.
To calculate representation on PSEDC boards, I used a representation index (RI) adapted from the U.S. Census Diversity Index.[7] The RI is used to compare the percentage of a racial group as a percentage of the PSEDC board to its state population and racial and ethnic proportions. The RI columns in Table 2 indicate the intensity and direction of representation. As the RI approaches the value “1.0,” this represents true parity or equal representation to the state population on the board. As values diverge from “1.0,” the degree of misrepresentation increases.
Overrepresentation is reflected by an RI greater than 1.0; underrepresentation occurs when the opposite is true and is reflected by an RI less than 1.0.
U.S. Census data from the Annual State Resident Population Estimates as of July 1, 2023, were used to identify the racial and ethnic population characteristics of each state. [8] For this research, the percentage of a population with Hispanic origin was counted without regard to race. To account for this, I used only the values for persons identified as not Hispanic in my calculations of the racial makeup of the remainder of the population.
Table 1:
Diversity of Private EDO Board Membership by State
| State | Private Economic Development Organization | Total Board Seats Occupied | Board Seats Held by a White Person | Board Seats Held by a Person of Color |
| AZ | Arizona Commerce Authority (ACA) | 30 | 25 | 5 |
| IN | Indiana Economic Development Corporation (IEDC) | 13 | 12 | 1 |
| MI | Michigan Economic Development Corporation (MEDC) | 20 | 11 | 9 |
| OH | JobsOhio | 9 | 7 | 2 |
| RI | Rhode Island Commerce Corporation (RICC) | 11 | 9 | 2 |
| TX | Texas Economic Development Corporation (TxEDC) | 11 | 7 | 4 |
| VA | Virginia Economic Development Partnership (VEDP) | 17 | 17 | 0 |
| WI | Wisconsin Economic Development Corporation (WEDC) | 17 | 13 | 4 |
| WY | Wyoming Business Council (WBC) | 12 | 12 | 0 |
| TOTAL | 140 | 113 | 27 | |
Table 2:
Racial and ethnic demographic comparison between state populations and PSEDC boards
| White | Black/African American | Asian | Hispanic | |||||||||
| Board | Pop. | RI | Board | Pop. | RI | Board | Pop. | RI | Board | Pop. | RI | |
| Group Averages | 81.2% | 68.2% | 1.24 | 12.0% | 9.6% | 1.23 | 3.5% | 3.7% | 0.89 | 3.3% | 15.5% | 0.37 |
| Arizona | 83.3% | 52.9% | 1.57 | 3.3% | 4.8% | 0.69 | 3.3% | 3.6% | 0.92 | 10.0% | 32.5% | 0.37 |
| Indiana | 92.3% | 77.0% | 1.20 | 7.7% | 9.9% | 0.78 | 0.0% | 2.8% | 0 | 0.0% | 9.9% | 0 |
| Michigan | 55.0% | 74.0% | 0.74 | 30.0% | 13.8% | 2.17 | 10.0% | 3.5% | 2.86 | 5.0% | 5.7% | 1.58 |
| Ohio | 77.8% | 77.3% | 1.01 | 22.2% | 12.9% | 1.72 | 0.00% | 2.7% | 0 | 0.0% | 4.5% | 0 |
| Rhode Island | 81.8% | 69.9% | 1.17 | 9.1% | 6.3% | 1.44 | 9.1% | 3.5% | 2.60 | 0.0% | 17.6% | 0 |
| Texas | 63.6% | 39.8% | 1.60 | 18.2% | 12.5% | 1.46 | 9.1% | 5.5% | 1.65 | 9.1% | 40.2% | 0.35 |
| Virginia | 100.0% | 59.8% | 1.67 | 0.0% | 19.2% | 0 | 0.0% | 7.2% | 0 | 0.0% | 10.5% | 0 |
| Wisconsin | 76.5% | 80.1% | 0.96 | 17.7% | 6.3% | 2.79 | 0.0% | 3.2% | 0 | 5.9% | 7.6% | 1.05 |
| Wyoming | 100.0% | 83.1% | 1.20 | 0.0% | 1.0% | 0 | 0.0% | 1.0% | 0 | 0.0% | 10.8% | 0 |
Endnotes
[1] Johnathan Morgan, “The Promise and Perils of Privatizing State Economic Development Agencies,” Community and Economic Development Blog at the UNC School of Government, November 5, 2013, https://ced.sog.unc.edu/2013/11/the-promise-and-perils-of-privatizing-state-economic-development-agencies/.
[2] Mike Krings, ”Public administration should consider effects of whiteness, masculinity as well as representation, researchers say,” KU News, February 17, 2022, https://news.ku.edu/news/article/2022/02/17/public-administration-should-consider-effects-whiteness-masculinity-well-representation.
[3] Arlene Martinez, “How Economic Development Subsidies Transfer Public Wealth to White Men,” Good Jobs First, June 12, 2023, https://goodjobsfirst.org/how-economic-development-subsidies-transfer-public-wealth-to-white-men/ .
[4] Benjamin Brunjes, et al., ”Representative Bureaucracy and Government Contracting: A Further Examination of Evidence from Federal Agencies,” Journal of Public Administration Research and Theory, October 2018, https://doi.org/10.1093/jopart/muy022.
[5] “Small Business Owner, Race, Liquidity, and Survival,” JP Morgan Chase & Co. Institute, July 2020, https://www.jpmorganchase.com/content/dam/jpmc/jpmorgan-chase-and-co/institute/pdf/institute-small-business-owner-race-report.pdf.
[6] State of Texas, Office of the Governor Appointment Application, https://gov.texas.gov/uploads/files/organization/appointments/Abbott_Application.pdf. See also State of Rhode Island, Application for Gubernatorial Appointment, https://docs.sos.ri.gov/documents/PublicInformation/ApplicationForGubernatorialAppointment.pdf.
[7] Eric Jensen, et al., “Measuring Racial and Ethnic Diversity for the 2020 Census,” U.S. Census Bureau, August 4, 2021, https://www.census.gov/newsroom/blogs/random-samplings/2021/08/measuring-racial-ethnic-diversity-2020-census.html.
[8] State Population by Characteristics: 2020-2023, https://www.census.gov/data/datasets/time-series/demo/popest/2020s-state-detail.html.
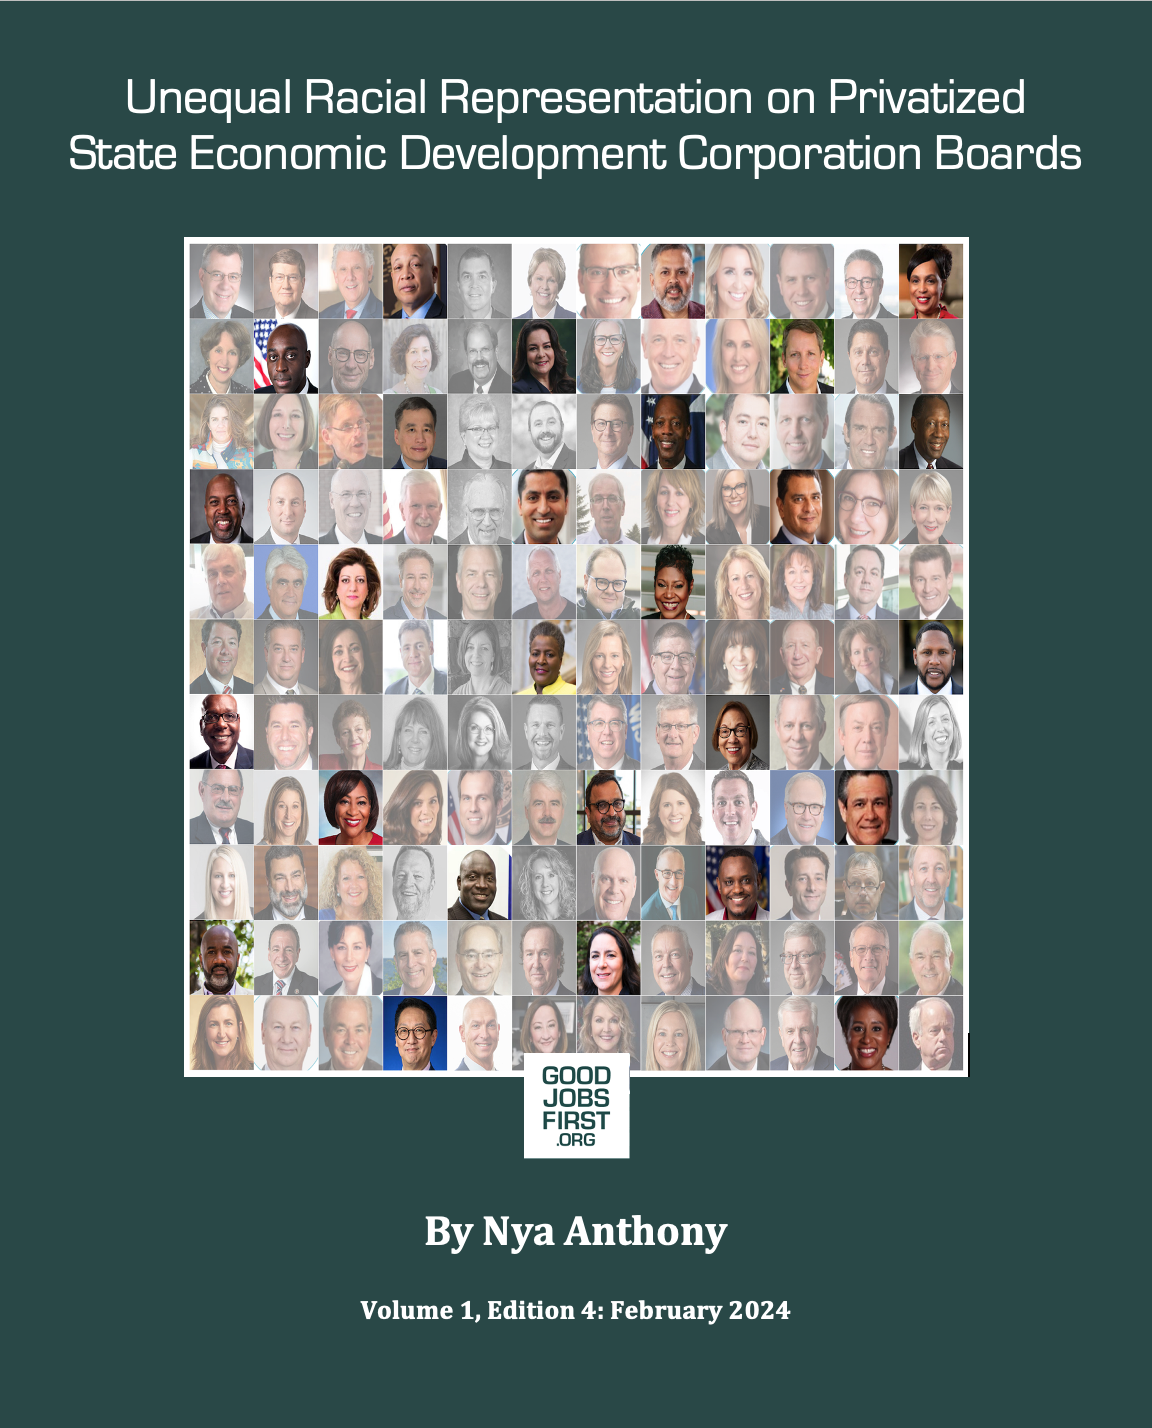
Cover image
Top row: Rick Johnson (IEDC), Dayton Molendorp (IEDC), Mike McLauchlan (MEDC), Sheldon Neely (MEDC), Erick Arens (WBC), Vicki Hollub (TxEDC), Clate Mask (ACA), Girish Rishi (ACA), Jenn Daniels (ACA), Mark Gaspers (ACA), Steven David Stone (VEPD – Offit Kurman), Dr. Beverly Walker-Griffea (MEDC)
Row 2: Linda White (IEDC), Awenate Cobbina (MEDC), Philip Shaltz (MEDC), Mary Jo Kaplan (RICC), Chuck Kenyon (WBC), Adriana Cruz (TxEDC), Cathleen Walker (ACA), Phil Gallagher (ACA), Pam Kehaly (ACA), J. P. Nauseef (JobsOhio), Eduardo Margain (TxEDC), L. Fredrick Francis (TxEDC)
Row 3: Sue McClosky (IEDC), April Clobes (MEDC), Dr. Robert McMahan (MEDC), An T. Lee (RICC), Cindy Johnson (WBC), Derek Smith (WBC), Josh Rubin (JobsOhio), Aaron Demerson (TxEDC), Ben Toma (ACA). Dr. Richard Gray (ACA), Jack Selby (ACA), General Lester Lyles (JobsOhio)
Row 4: Dr. Bill Pink (MEDC), Brian Rich (MEDC), Mike Kubacki (IEDC), David Chenevert (RICC), Chuck Brown III (WBC), Simer Mayo (ACA), Henry Newell (WEDC), Sandra Watson (ACA), Gov. Katie Hobbs (ACA), Dr. José Luis Cruz Rivera (ACA), Sherry Martin (ACA), Nancy Howell Agee (VEPD – American College of Healthcare Executives)
Row 5: George Nee (RICC), Mark Miles (IEDC), Fay Beydoun (MEDC), Anthony Tomczak (MEDC), John Arnold (ACA), Karl Wadensten (RICC), John Brogan (WEDC), Donna M. Sams (RICC), Lisa Mauer (WEDC), Sharon Harper (ACA), Mayor Douglas Nicholls (ACA), Michael Bidwill (ACA)
Row 6: Dominic Grote (IEDC), Thomas Lutz (MEDC), Gina Jacquart Thorsen (MEDC), Ryan Waddington (MEDC), Erin Moore (WBC), Thelma Sias (WEDC), Katie Farmer (TxEDC), Rep. David Armstrong (WEDC), Mara Aspinall (ACA), Stephen Q. Miller (ACA), Mimi Rainero Coles (VEPD – LinkedIn), Adrian Cannady (TxEDC)
Row 7: John T. Thompson (IEDC), Mike Kunesh (WEDC), Dr. Brenda Dann-Messier (RICC), Pam Thayer (WBC), Elaine Harvey (WBC), Joe Schaffer (WBC), Brad Pfaff (WEDC), George Henderson III (TxEDC), Dr. Jerry Sue Thornton (JobsOhio), Robert Robbins (ACA), Dr. Michael Crow (ACA), Carrie Hileman Chenery (VEPD – Valley Pike Partners)
Row 8: Joel Gorelick (IEDC), Krista Flynn (MEDC), La June Montgomery Tabron (MEDC), Liz Catucci (RICC), Sen. Warren Petersen (ACA), John Casper (WEDC), Arun Agarwal (TxEDC), Kathy Blumenfeld (WEDC), Peter Holt (TxEDC), Dr. John Lechleiter (IEDC), Tony Astorga (ACA), Pace Lochte (VEPD – University of Virginia)
Row 9: Kristin Marcucilli (IEDC), Kyle Caldwell (MEDC), Carol O’Donnell (RICC), Mark Law (WBC), Bobby Hopewell (MEDC), Kim Devore (WBC), Jack Salzwedel (WEDC), Randy Hopper (WEDC), Samba Baldeh (WEDC), Danny Seiden (ACA), Nick Rush (VEPD – LinkedIn), Dr. Stacy Klippenstein (ACA)
Row 10: Willie Smith (WEDC), Michael Solomon (RICC), Lizabeth Ardisana (MEDC), William Stone (RICC), Peter Barca (WEDC), Thomas Williams (JobsOhio), Eugenia Podesta (WEDC), Scott Sullivan (JobsOhio), Anne Oman (VEPD – LinkedIn), Richard Platt (JobsOhio), Stephen E. Cummings (VEPD – VA Department of Finance), William H. Hayter (VEPD – Wellspring Foundation)
Bottom row: Amy Schumacher (IEDC), Wes Kremer (ACA), William Pilcher (ACA), Dr. Santa Ono (MEDC), John Hewa (VEPD – Robbins School of Business), Marianne Radcliff (VEPD – LinkedIn), Caren Merrick (VEPD – VA Commerce Department), Lori Marie Gillett (JobsOhio), Daniel Feyen (WEDC), John Bishop (JobsOhio), Monica Garnes (ACA), William D. Sessoms, Jr. (VEPD – Flickr)