Good Jobs First gratefully acknowledges Policy Matters Ohio for collaborating on this project, especially Gavin LaPlace for his census tract-level analysis.
Executive Summary
Thanks to a unique disclosure provision of a state incentive in Ohio, this study analyzes the otherwise notoriously opaque federal Opportunity Zones (OZ) program. The state has 320 OZs in which we were able to examine 1,600 investments made between 2020 and 2023 totaling $1.03 billion.
While the state-disclosed investments may not include all OZ investments in Ohio (because some unknowable share of OZ investors may not have applied for the state’s additional OZ incentive) we find that for those that are disclosed:
- The investments are concentrated in a small number of urban areas, mainly Cleveland, Columbus, and Cincinnati. Indeed, just five cities received 88% of the dollars invested.
- The investments are concentrated in just 120 of the state’s 320 OZs.
- OZs in rural and Appalachian Ohio received almost no investments.
- OZs that have received investments tend to have gentrifying characteristics — becoming whiter and richer.
- Almost 16% of the money invested has been within one mile of a college campus. College towns often qualified as an OZ not because they were economically depressed, but because the large student populations drove down the average wage.
Taken together, our findings indicate that Opportunity Zones in Ohio have not benefited historically disenfranchised communities that OZ supporters said would gain.
Although there is currently federal legislation looking to extend and expand the program, we recommend that the program be allowed to sunset in 2026. Additional transparency and reporting requirements, included in proposed legislation to extend and expand the program, would not change the underlying problems with the program, which include its limited participation pool (only those with capital gains can access it); lack of community input in the types of projects the tax breaks support, and that it appears to have failed to drive investment in the poorest communities, in Ohio and beyond.
Introduction: Opportunity Zones 101
Opportunity Zones were established as part of the 2017 Tax Cuts and Jobs Acts, ostensibly as an economic development tool. They are designated low-income census tracts where individuals or corporations may receive federal capital-gains tax breaks for investing through vehicles called Quality Opportunity Funds (QOF).
There are currently 8,764 OZs located in all 50 states, the District of Columbia, and five U.S. territories. It was estimated by the Joint Committee on Taxation that this program would cost $1.6 billion between 2018 and 2027.
Capital gains taxes apply to the appreciation of an asset, in other words, how much more valuable an investment becomes between buying and selling it. For example, if an investor bought stocks for $10 million originally, but then sold them a few years later for $50 million, they would owe a capital gains tax on the $40 million increase.
But under the Opportunity Zone program, if the investor reinvests that $40 million increase into a QOF, they can qualify for a lower capital gains tax rate and even a capital gains tax exemption. By investing in a QOF, the investor gets to defer paying the capital gains tax, for as long as the money is invested.
If investment is held long enough, there is a significant reduction in the amount of capital gains tax that will need to be paid. If the investment is held for more than 10 years, any increase in the original investment will be tax-free. This means that if after 10 years the original $40 million investment is now worth $60 million, there will be no tax on the $20 million increase.
QOFs can invest in a range of projects, including businesses, homes or apartments, commercial real estate, storage facilities or college dormitories.
The geographical boundaries of Opportunity Zones are based on census tracts. State governors were able to select “low-income” areas that based on 2010 census data had a poverty rate of at least 20%, or a median income that was no greater than 80% of the median income in their metropolitan area. A total of 42,176 census tracts had demographics that qualified them for OZ designation. The Tax Cuts Act required each state governor to select about one-fourth of those eligible tracts as OZs. The Act also allowed governors to designate better-off census tracts that border OZ-eligible tracts as OZs (for up to 5% of a state’s OZs).
Good Jobs First and others have criticized OZs for numerous structural flaws, including their lack of transparency. Because the claiming of federal income tax credits is a matter between a taxpayer and the Internal Revenue Service, OZs provide no way to determine who is benefiting from them, or by how much, or what results from the tax-sheltered investments.
However, this study takes advantage of one state’s unique data “crevice.” Like numerous states, Ohio enacted its own state incentive program atop the federal OZs. The Buckeye State applied its existing disclosure regimen to it, which enabled this study.
What Are the Critiques of OZs?
There are many critiques of this program, including that the selection process for choosing the OZs was flawed (a Policy Matters Ohio analysis found that most of the state’s poorest tracts were not selected for inclusion in the program but some of Cleveland’s fastest-growing neighborhoods were), that it spurs gentrification, and that it allowed too many project types. [1]
Another critique of the program is that it is inaccessible for most taxpayers. In fact, in the United States, 85% of capital gains are generated by just 5% of taxpayers. Most of those are white individuals. One study found that OZ investors have an average household income of over $1 million. Also, as mentioned above, many QOFs set up minimum amounts to participate, effectively allowing only the very wealthy of an already wealthy group to invest. [2]
One other issue pointed out by researchers is that some of the designated OZs are located near colleges or universities. Due to the large number of students, some of these places were designated as low-income even though the area is not disadvantaged. One national study found 33 designated OZ tracts where at least 85% of the population were students. One such zone is home to the University of Southern California, which has a “poverty rate” of 88%, even though 99% of its residents are students.
Another major concern surrounding the OZ program was whether it would intensify gentrification. Research has found that gentrifying OZ tracts have received more investment than tracts without gentrification indicators, which could hasten or worsen the process.[3]
The OZ program also allows for a wide range of development types to be allowed, including luxury housing and long-term storage facilities, neither of which produce many permanent jobs, noted David Wessel in his book, Only the Rich Can Play: The Story of Opportunity Zones.
Why Does Ohio Have Better Disclosure?
In 2019, the state created the Ohio Opportunity Zone Tax Credit, which offers tax incentives for eligible investments in qualified projects located in one of its 320 Opportunity Zones. Under this program, once money is invested in an OZ, the taxpayer is eligible for a non-refundable Ohio tax credit equal to 10% of the amount invested. The program has disclosure requirements, unlike the federal program. Ohio’s disclosure is published in the Department of Development’s annual report.
This report includes project descriptions, the project’s address, the name of the QOF, the total amount of fund investment into the project, and each individual taxpayer’s investment into the project. These data points, together with other public data, enabled an analysis that is simply not possible in any other state.
Ohio had 1,647 eligible census tracts for OZ based on income eligibility requirements. Of the 320 selected ones, 317 were low-income tracts, while three were more affluent neighboring tracts.
QOFs must apply separately for the added Ohio tax credit. This means that the state’s disclosure system does not capture all federal OZ investments, but rather only those that applied to and qualified for the state credit. Ohio’s Department of Development reports accepting 93% of applications, which are the ones analyzed for this report. Due to the lack of transparency at the federal level, it is impossible to know how many more Ohio OZ investors did not apply for the state-level credit.
Analysis: Big City Dominance
Between 2020 and 2023, Ohio received at least $1.03 billion in 1,600 OZ project investment commitments at 502 unique addresses (there is no limit on how many OZ investments can occur in a zone). Although Ohio has 320 designated OZs, investment has occurred in only 120. Almost all of these 1,600 investments occurred within cities, including gentrifying areas, or near a college or university campus.
The 502 unique investment locations are concentrated in cities, namely the three C’s: Columbus, Cincinnati, and Cleveland.
Image 1: Count of OZ Investments by Regions
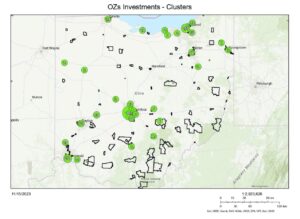
The above illustration shows the heavy concentration of investment locations in urban areas. The black-outlined areas represent census tracts that are designated OZs. Although southeast Ohio has many census tracts designated as OZs, there have been almost no investments made there thus far. This region, Appalachian Ohio, has been historically disinvested and experiences high amounts of poverty,[4] a trend that OZs have done nothing to reverse.
Of the 1,600 investments, 83% of them — with 88% of the total dollars — have occurred in just five cities, as shown below.
Table 1: Top 5 Cities in Ohio with the highest number of investments
| City | Number of Investments | Total Investments |
| Columbus | 666 | $269,691,680 |
| Cleveland | 260 | $411,640,519 |
| Cincinnati | 207 | $120,348,504 |
| Grove City | 138 | $64,949,604 |
| Dayton | 61 | $40,560,799 |
Columbus, Ohio’s state capital and largest city, has the highest number of investments in the state, with a total of almost $270 million in over 600 projects initiated between 2020 and 2023. Grove City, a suburb of Columbus, has the fourth largest number of investments with almost 140 projects valued at $65 million. Cleveland has fewer investments, 260, but they are typically larger: more than $400 million invested so far.
Other significant investments have occurred in Toledo and Springfield. In Toledo, 19 investments total $13.5 million. In Springfield, 56 investments total $11.8 million so far. Springfield is a much smaller city than the others listed, with only 60,000 residents, but has seen a recent real estate boom, including in OZs.
Between these seven cities, there are 1,407 investments, or 88% of the total number of investments in Ohio, and $932 million invested, or 91% of the total dollars.
Although OZs were facially intended to help areas throughout every state, in Ohio only urban areas have seen significant amounts of investment, while rural areas have seen little to none.
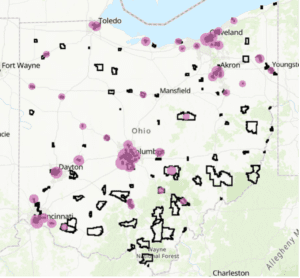
This phenomenon is made clear by analyzing tracts with and without investment. In fact, only 120 tracts (37.5%) received any investment. As seen in Image 2, only the purple highlighted areas have had OZ activity. Although 320 Ohio census tracts were designated as OZs, there are no guidelines, in either the state or federal programs, requiring that investments be spread across the state.
Image 2: Highlighted OZ Tracts with Investment
OZs and Gentrification
Our analysis makes clear OZ investments have gone to areas showing signs of gentrification. According to data analyzed by Policy Matters Ohio (PMO), just before the program began, OZ-designated areas in the state between 2020 and 2022 were already seeing increases in median income, decreases in the poverty rate, and a greater share of white residents, which are all indicators of gentrification.
This confirms a concern that was raised when OZs were first enacted, and that other research has confirmed. Because the program does not require equitable outcomes, investors are free to go to areas where real estate values were already showing the greatest strength.[5]
PMO used American Community Survey (ACS) data to examine population trends, comparing estimates from the 2010-2014 and 2014-2018 datasets. Between the two periods, PMO compared the demographic changes in OZ-designated tracts with investments to those without between 2020 and 2022. This analysis covers just the first years of the program, not 2023, but confirms that during that time, OZ investors were mostly attracted to zones that on average were showing demographic changes characteristic of gentrification.
Table 2: Examining the Changing Demographics of Ohio OZs between 2010-2014 and 2014-2018
| Average % Change in Average Income | Average % Change in Poverty Rate
|
Average Change in Residents with a bachelor’s degree | Average % Change in White Share of Population | Average % Change in Black Share of Population | |
| OZs with Investment | +28.74% | -8.86% | +43.42% | +1.18% | -2.64% |
| OZs without Investment | +14.16% | -3.84% | +17.72% | -1.16% | -0.48% |
Investments went to tracts that were already experiencing higher increases in personal income, faster declines in poverty rates, higher increases in the number of residents with bachelor’s degrees, increases in the white population, and faster decreases in the share of Black residents. All of these demographic changes are in line with the definition of gentrification.[6]
Example: Cincinnati’s Over-the-Rhine neighborhood. The area is composed of four census tracts, all four of which are designated as OZs, and have seen heavy investments. These are also heavily gentrifying tracts. In 2000, the neighborhood was 19% white and 76% Black. In 2010, it was 25% white and 72% Black. In 2020, it was 47% white and 43% Black.
Between 2010 and 2020, the share of Over-the-Rhine residents with at least some college education increased from 53% to 74%, another tell-tale sign of gentrification.
The four Over-the-Rhine zones have seen over $25 million in OZ investments. In an already rapidly gentrifying neighborhood, these investments may be accelerating the trend.
College Campus-Area Investments
An early criticism of the OZ program was that some census tracts deemed eligible to be OZs look artificially poor because college students living in them have low incomes. To examine this issue in Ohio, we did a spatial analysis, analyzing investments within one mile of any college or university with an enrollment of over 1,000 students. We found that between 2020 and 2023, 209 investments — more than one in eight statewide — met this criterion. The sum of these investments is $418.9 million, or 16% of the total dollars.
Image 3: Map showing designated OZs, large colleges and universities, and OZs with investment
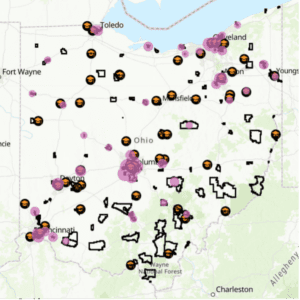
Image 3 illustrates the concentration of college and university communities that have received OZ investments. Represented by the black circles and graduation caps, these areas tend to overlap with the invested-in OZs, highlighted in purple.
Cities with OZ investments within one mile of a college or university were: Akron, Dayton, Cincinnati, Cleveland, Columbus, and Youngstown.
Akron is home to the University of Akron Main Campus, a university with 12,000 students. There are three investments located within a mile of the campus, totaling more than $5 million in investments (the university’s campus itself is also designated as an OZ, although no investments have been made there yet). In Cleveland, there are two prominent universities: Cleveland State University and Case Western Reserve. There are 18 OZ investments within a mile of Cleveland State, and 17 within a mile of Case Western.
Image 4: An in-depth look at Cleveland State University

Image 4, of the Cleveland State area, illustrates where investment has occurred. The green dots represent investments, and those with circles surrounding them are within a mile of the university. The blue tract shading signifies the percentage of the population that is white, with the lighter the color the higher the share of white residents. The tracts with 60% or more white residents received all but one investment. It is also worth noting that the tracts with more investment are closer to Cleveland’s downtown area, while the tracts to the east and south have seen almost no investment.
Columbus, home to several large universities including Ohio State University’s main campus, Capital University, and Columbus College of Art and Design, sees similar racial disparities. Investments in Dayton that are within one mile of a college or university are in OZs that are predominantly white. One of these projects is for off-campus student housing and has received an investment of over $6 million.
We also found higher educational attainment overall in sites with OZ investment. In those invested tracts, 21% of the population had a bachelor’s degree or higher and 51% had only a high school or lesser education. In OZ tracts without investment, just 12% of the population on average had a bachelor’s degree or higher, and 58% had a high school degree or less.
Policy Recommendations
Good Jobs First recommends that the federal Opportunity Zone program be allowed to expire on schedule in 2026. Although there is proposed legislation to extend the duration and expand the scope of OZs, our findings are consistent with other research that shows OZs are limited in impact and, by design, drive benefits to some of the wealthiest individuals and companies.
The new legislation has provisions to designate more rural areas as OZs, but subsidized development usually fails to bring prosperity to poor communities, and OZs have proven to be no exception.
Opportunity Zones are investments only accessible to the already wealthy, and this analysis and others show that OZ investments favor areas that are already gentrifying.
OZs lack any community benefits, or “strings,” such as affordable housing, living wages, local hiring, MWBE contracting set-asides, or green construction. Making OZs a little more transparent won’t repair their inherently flawed structure. Our findings reinforce our longstanding recommendation that the program be allowed to sunset and that states also sunset their OZ add-on incentives.
Appendix A: Data and Methodology
All data about Ohio Opportunity Zone locations were collected from the annual development reports, published by The Ohio Department of Development Data was taken from the application round project list, published in the report’s appendixes, from 2020 to 2023.
College and university locations data was gathered from Integrated Post-Secondary Education Data from the Homeland Infrastructure Foundation-Level Data database. It was last updated in 2022. For the purposes of this report, only colleges with student housing capabilities and a total enrollment of over 1,000 students were included. We found information on the demographics of each census tract and their OZ status from the Urban Institute’s tract-level data. [7]
To perform our data analysis, we started by creating a map presenting the investment locations across the years 2020-2023 overlayed with economic and demographic data. In addition to the investment and economic data, we added the college and university data mentioned above. The tool we used for developing the dynamic map was ArcGIS Online.
Our final map includes nine layers: Ohio OZ boundaries, locations of the investments, college and university locations, investment locations near colleges (within one mile), all marked as points on the map, as well as economic layers consisting of median household income and poverty rate, and demographic layers consisting of white, Black, and Hispanic population both presented in a form of a gradient map (the higher the share, the darker the color).
The initial investment dataset was originally organized by individual investors, resulting in multiple entries for the same project with varying investment amounts based on the taxpayer investor. We were able to consolidate the yearly datasets into a unified, comprehensive dataset with a consistent format, however, we encountered a challenge with Excel files that contained merged cells when uploading the file to ArcGIS. To combat any data issues, from merging or unclear disclosure, we aggregated the data by street address to include all instances of investment at a particular location. All investment dollar amount information is based on taxpayer investment amounts disclosed by Ohio’s Department of Development.
The map was designed to be interactive and allows for accessing information based on a specific location. [8]
Appendix B: Ohio’s Demographics
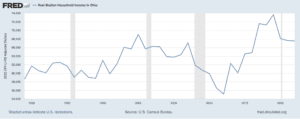
In 2022, the median household income in Ohio was $67,520, compared to the national average of $74,580.
Real Median Household Income in Ohio
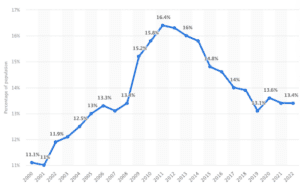
Ohio also has a higher than national percentage of people living below the poverty line. In 2022, it was 13.4% compared to 11.5% nationwide.
Poverty rate in Ohio in the United States from 2000 to 2022
Endnotes
[1] See Policy Matters Ohio’s report “Assessing Opportunity Zones in Ohio”
[2] See Brookings report “Learning from Opportunity Zones: How to Improve Place-Based Policies” and Capital Squares analysis “Opportunity Zones Go to College: How An Income-Level Loophole Benefits Higher Learning”
[3] See National Low Income Housing Coalition’s report “Gentrifying Opportunity Zones are More Likely than Non-Gentrifying Opportunity Zones to Receive Investments”
[4] See, for example: The Center for Community Solutions analysis of Appalachia Ohio, “Rural Poverty and Rent Burden in Appalachia Ohio: A Dangerous Crisis”
[5] See, for example: RCLCO’s analysis of OZ tracks “Building Opportunity: Mapping Gentrification and Investment Across Opportunity Zones” (January 29, 2019) and a topic of a blog “Opportunity Zones: Gentrification on Steroids?” by William Fulton at Kinder Institute for Urban Research at Rice University (February 20, 2019). The National Community Reinvestment Coalition finds that “69% of neighborhoods that gentrified between 2000 and 2017 are either an Opportunity Zone or they are adjacent to one.” A mapping tool allows the viewer to easily see the location of gentrified Opportunity Zones.
[6] There are many demographic data points that are used as indicators of gentrification, including share of the white population, population with bachelor’s degrees and the poverty rate. These indicators have been used in many other reports that measure gentrification, including NBER’s “Measuring Gentrification: Using Yelp Data to Quantify Neighborhood Change” and “Defining Gentrification for Epidemiologic Research: A Systematic Review.”
[7] See here: https://nces.ed.gov/ipeds/ and here: https://www.urban.org/policy-centers/metropolitan-housing-and-communities-policy-center/projects/opportunity-zones
[8] The interactive map is located here: https://georgetownuniv.maps.arcgis.com/apps/mapviewer/index.html?webmap=38fefb529cef4f0db88c6531ad1a3b88
