In the second part of the blog on the Environment Agency, we will be digging deeper into the data provided by Violation Tracker UK (‘VTUK’). This will entail looking at the top enforced against industries by the Environment Agency, the number of enforcement actions the top industry has had over the last 10 years and similarly the average fine for this industry.
Part 1 of the blog on the Environment Agency found that there had been a 6-fold decline in enforcement actions by the UK Environment Agency over the last 10 years. Furthermore, after looking into the Environment Agency’s budget, it was found that in real terms there has been close to a 50% cut in their environment protection grant from DEFRA, meaning that the Environment Agency are working with less resources. But what does this mean for various industries and who are the top enforced against industries by the Environment Agency?
The data: Utilities and power are the most enforced against, oil and gas are missing in action
If we start by looking at the top 10 enforced against industries by the Environment Agency since 2012, it can be seen in the chart that utilities and power corporations provide 67% of the top 10 enforcement actions by the Environment Agency since 2012. If we look at this figure out of all industries, not just the top 10, then utility and power corporations account for 59% of enforcement actions carried out by the Environment Agency.
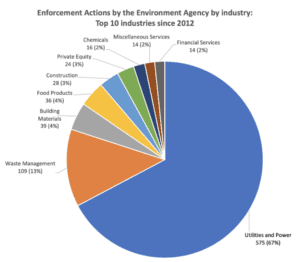
What is intriguing about this chart is that oil and gas corporations are not one of the top 10 enforced against industries by the Environment Agency. In fact, oil and gas corporations only account for 1% of all enforcement actions carried out by the Environment Agency. Yet, we know that globally the top 103 fossil fuel corporations are responsible for 70% of all emissions. Therefore, it could almost be naively assumed that oil and gas would be more heavily featured in this chart and that more action would be taken against them than 11 enforcement actions since 2012 by the Environment Agency. Furthermore, the other regulating authority of the oil and gas industry are the North Sea Transition Authority (formerly the Oil and Gas Authority), who have only had 2 enforcement actions against oil and gas corporations in the last 10 years.
Now let’s look more closely at the top industry in this chart, the utilities and power industry.
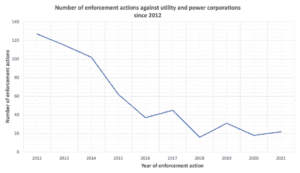
Since 2012, enforcement actions against utility and power corporations have seen a 6-fold decline. This is in line with what was found during the last blogpost looking at Environment Agency enforcement actions against corporations for environmental breeches more widely.
VTUK data also enables us to look at the average fines for utility and power corporations over the last decade. The results of this show that the average level of fines have been increasing. In fact, if we look at the average of all fines for 2012 which was £5,890, the overall average increased in 2021 to a massive £45.6 million. Now, 2021 was an interesting year, as Southern Water received their biggest fine in the environment Agency’s history at £90 million. Therefore, this does create an outlier in the data. It would be worth noting that there has not been a fine as big by the Environment Agency this year. But even if we look at the average fine for the years prior, the overall average for 2020 was £133,688. Between 2012 and 2020, there was a 22-fold increase in the overall average fine.
As such, the data tells us that the Environment Agency is enforcing against utility and power corporations less often but being tougher with fines.
Zooming in on the data: Water companies and water pollution
It would be easy to argue that the chart above shows utility and power corporations as having a disproportionate amount of enforcement action against them. However, we don’t know the total sum of all corporate environmental crimes committed to know if this is disproportionate.
When looking further at the company types which fall under the banner of utilities and power corporations, it becomes apparent that water companies are particularly focused on as part of the 575 enforcement actions. This may be because of the rise in water pollution incidents, which is at its highest since 2014. But also, possibly because the Environment Agency recently noted that only 14% of British rivers meet Good Ecological Status under the Water Framework Directive. Alternatively, there has been increasing press coverage about sewage releases from storm overflow pipes over the last few years. Therefore, the Environment Agency has likely been under greater pressure to focus on water companies. Plus, with limited resources, it may be why more attention has been directed at these companies instead of a broader spectrum of industries.
The takeaway: Increasing fines and decreasing enforcement actions are not working
Water corporations are continuing to pollute waterways in the UK at a worrying rate; recently, sewage has never been so popular in the news. Yet, these corporations are also the ones who garner the most attention from the Environment Agency, which seems paradoxical. The current environmental regulatory system is broken, the tougher penalties but less enforcement action approach is not working. However, whilst giving the Environment Agency more resources seems like it would be an immediate fix, if the political favouring of deregulation are still present, it is likely that not much would change.